Searching:
0 results found Back
BackViewing Widget Data
After a widget has been added to a Dashboard, the widget’s Event readings are automatically reported and display in the widget. The widget automatically displays the latest Event readings. All Event readings that meet the criteria defined for the widget are included, regardless of when received.
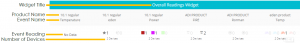
Each Product-Event combination is represented in a separate column in the widget.
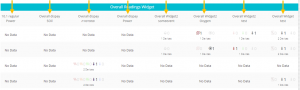
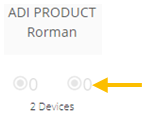
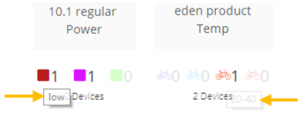
The first row of the widget shows the Product name and the second row shows the Event name. The third row shows the actual Event reading. The icons and labels in this row are based on the Event definition in the Product. The fourth row shows the number of Devices of the specified Product type that reported Event readings with the specified value or value range.
Events for which no data was ever received show 0, and are grayed out.
You can hover over an Event reading to see the value or value range for that reading.
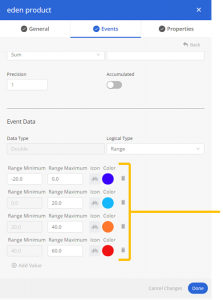
Event readings in the widget display based on the Event definition in the Product. For example, the icons and colors of the reported Event readings are defined in the Events tab for the Product, as shown below. These attributes can be defined for one or more value ranges. For more details, see xxx.