
Searching:
0 results found Back
BackUtilization Dashboards
Utilization Widget
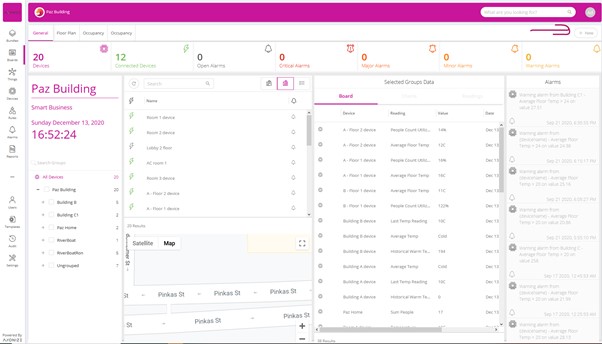
In order to create a utilization dashboard go to the boards section and press the “+ New” button in the right side of the ribbon.
Then choose the utilization dashboard
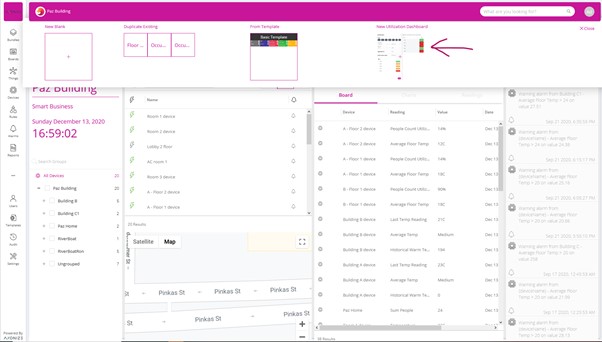
This will automatically create and open a new dashboard
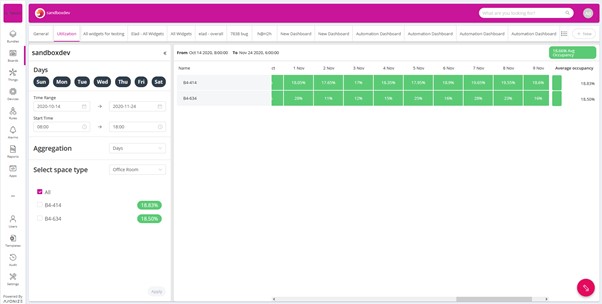
All the configurations are done on the left side of the screen. Once the apply button is clicked, the configurations are saved and the dashboard is recalculated. The dashboard will aggregate readings with type code 44 – “Utilization”
Configuration options are as follows:
- Days: Selecting which days of the week are relevant for the dashboard enables you to remove weekends or to look at specific days of the week.
- Time Range: Select the dates from which to bring data.
- Start Time: Select the work hours. Since utilization will usually be almost zero after the standard organization working hours, it is useful to filter out the hours in which when you expect the utilization to be zero.
- Aggregation: Select between Hours, Days, Weeks and Months regarding how you would like to roll up the data. For each bucket the utilization will be averaged.
- Select Space Type: The system will automatically detect all group templates which have a utilization event defined, and will let you select between the two, displaying all instances of that group template in the grid. If a group template has multiple events with type code 44 – “Utilization,” an additional drop down will let you choose between them.
Once the options have been selected, and the apply button clicked, the system will display all the things with a utilization average in each box. The grid can be sorted by thing name (by clicking on ‘name’ in the grid,) or by utilization percent (by clicking on ‘average occupancy’ in the grid.)